Ising on the Cake
Going through a difficult phase transition
Ask NotebookLMThe Ising Model
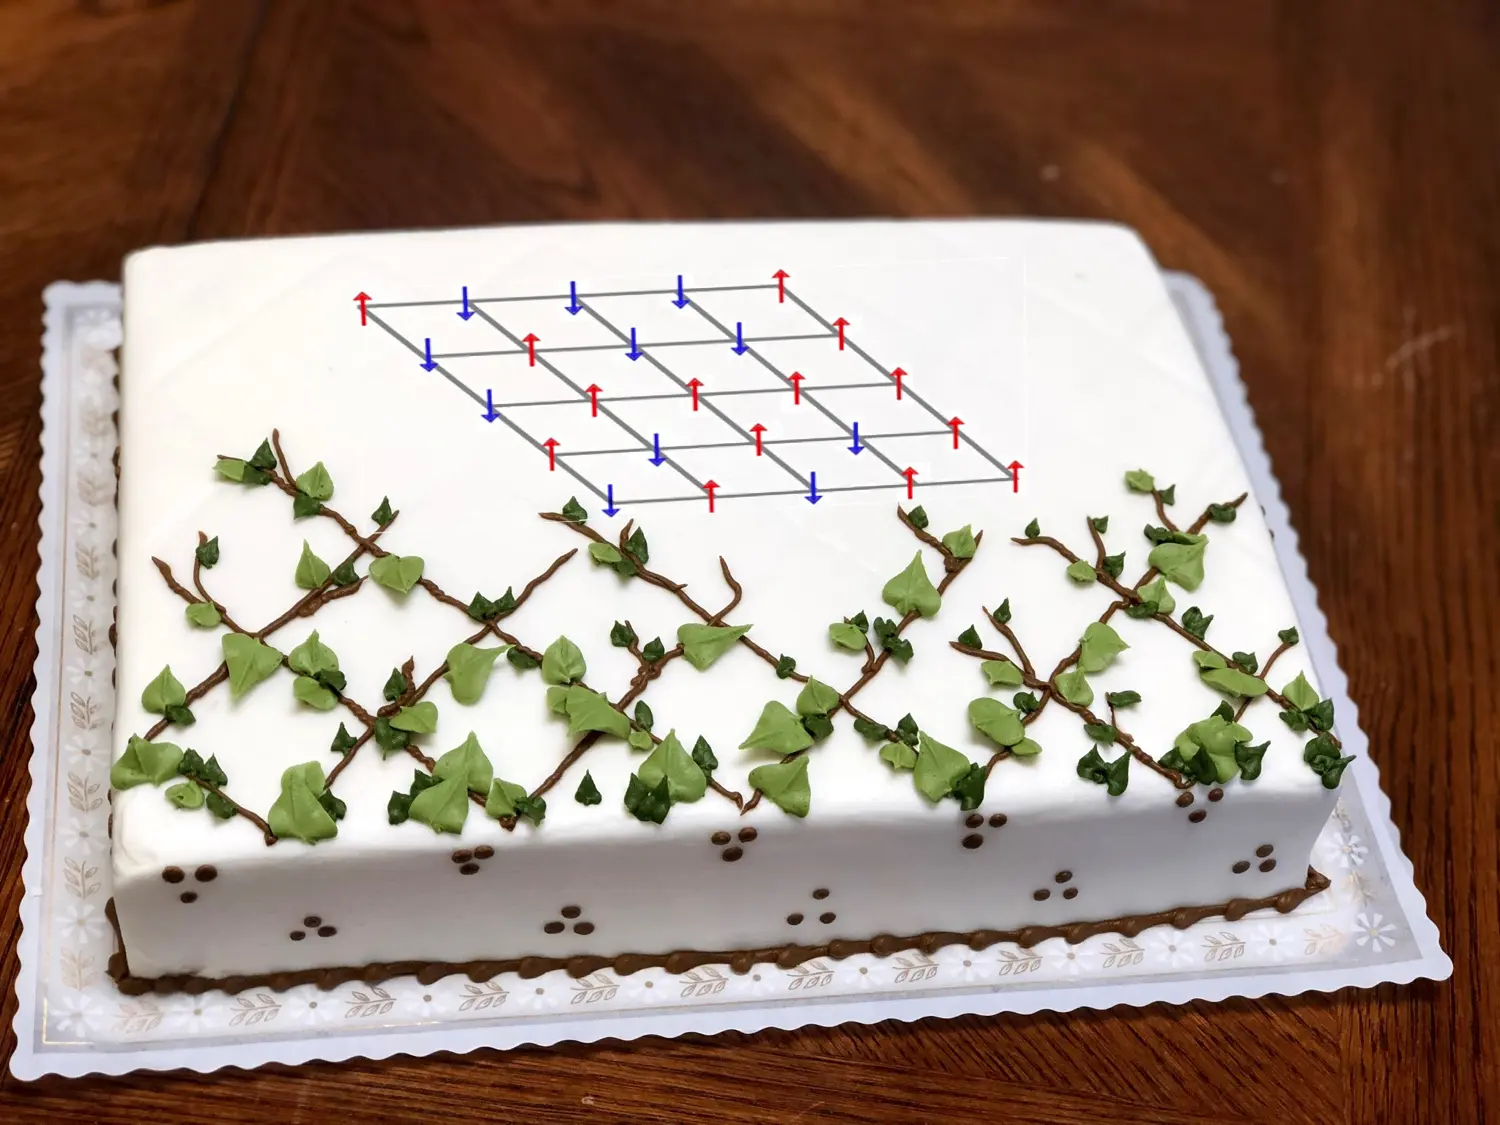
Wilhelm Lenz was a professor of theoretical physics at the University of Hamburg from 1921 to 1956. Ernst Ising was a student of Lenz’ and solved what is now known as the one-dimensional Ising Model in his thesis Beitrag zur Theorie des Ferromagnetismus published in 1925. The model represents magnetic dipole moments of atomic spin that may be in one of two states, up and down, and modeled as or over a grid of dipoles. Lenz invented the concept in 1920, but it was Ising who first solved it. Later, Lars Onsager solved the two-dimensional version in 1944 and P. F. Barth solved the problem for arbitrarily large dimensions in 1981.
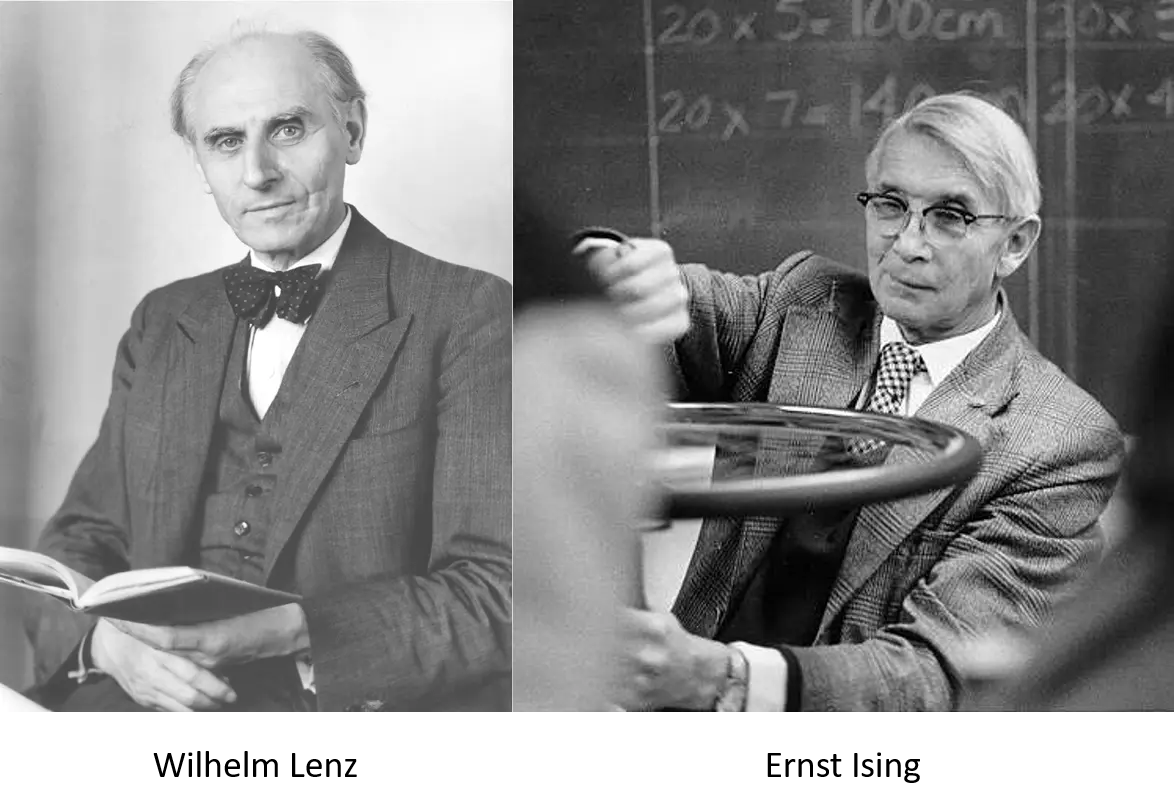
A dipole moment is the measure of the separation between two electrical charges with opposite polarity, and is equal to the magnitude of the charge of the two particles times the separation distance. In a water molecule the hydrogen atoms have a positive charge while the oxygen atom has a negative charge. The angle formed by the atoms is and the dipole moment is the vector from the midpoint between the hydrogen atoms pointing towards the oxygen atom. The dipole moment is where is the magnitude and is the separation distance.
Dipole moment of the water molecule.
Imagine you have a grid of tiny magnets, each one pointing either up or down. These magnets represent the “spins” of particles in the material. In the Ising Model, each magnet interacts with its neighbors, meaning it wants to align its direction with them. The key idea is that each magnet has a preference to either align with its neighbors (trying to lower its energy) or go against them (which increases its energy). This preference is determined by the temperature of the system and the strength of the interaction between magnets.
At higher temperatures, the magnets are more likely to be randomly oriented because they have enough energy to overcome the interaction between them. As the temperature decreases, the magnets start to align more and more, leading to what we call “order” in the system. This is similar to how ice crystals form when water cools down.
The Ising Model helps scientists understand phase transitions, where a material changes from one state to another, like from a magnetized state to a non-magnetized state (or vice versa). It’s also used in various fields beyond physics, such as biology and computer science, to model systems with interacting components.
Details of the Model
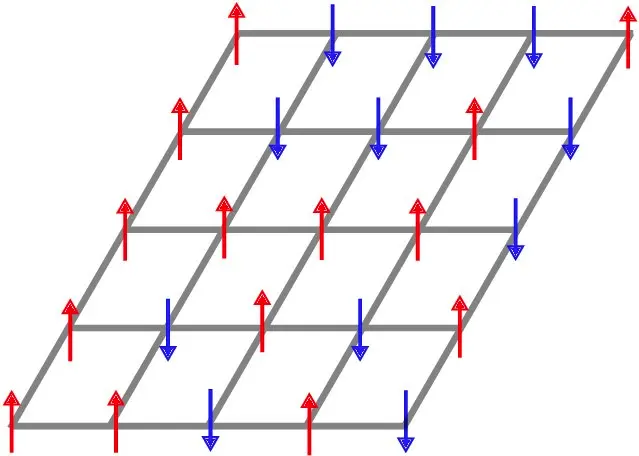
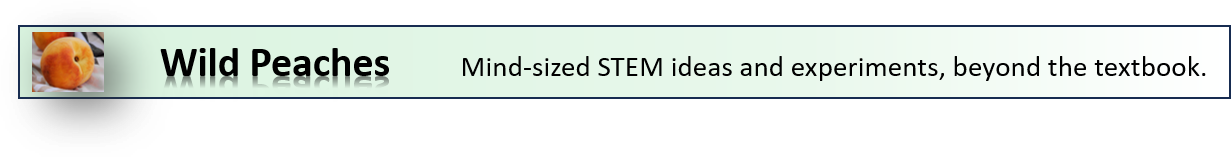
Schematic representation of a configuration of the 2D Ising model on a square lattice.
In the schematic shown above, dipoles spinning in the (up) direction are shown in red, while the (down) dipoles are in blue. Interactions occur between the four nearest neighbors connected by the gray gridlines. The spin at node is and the energy of the entire grid is
where is the interaction between nearest neighbors on the grid. For example, a down spin surrounded by four up spins (either of the two blue spins in the second line from the bottom) would have a sum of for the first term. The second term is the sum of all the spins, so in this example, there are up spins and down spins for a total of . The parameter measures the strength of the coupling between adjacent magnetic dipoles, and is the effect of any external magnetic field.
The Metropolis Algorithm
The Metropolis (or Metropolis-Hastings) Algorithm is a Markov Chain Monte Carlo (MCMC) method that generates a sequence of random numbers from a probability distribution. A Markov Chain is a sequence of states where the current state depends only on the previous state, and the Monte Carlo method is a way to create random samplings.
The Metropolis algorithm is a computational method used to simulate the behavior of systems described by statistical mechanics, such as the Ising Model. It’s particularly useful for systems with many interacting components, where exact solutions are difficult or impossible to obtain.
Here’s how the Metropolis algorithm works within the context of the Ising Model:
- Initialize the system: Start with an initial configuration of spins (magnets) on a grid. Each spin can be randomly assigned an orientation, either up or down.
- Select a spin to flip: Randomly choose one spin from the grid. This spin will be considered for flipping its orientation.
- Calculate energy change: Compute the change in energy that would result from flipping the selected spin. This involves considering the interactions between the selected spin and its neighboring spins according to the rules of the Ising Model.
- Accept or reject the flip: If the energy change is negative (i.e., flipping the spin lowers the total energy of the system), accept the flip. If the energy change is positive, accept the flip with a probability determined by the Boltzmann factor: , where is the energy change, is the temperature of the system, and is the Boltzmann constant. This probabilistic acceptance allows the system to explore higher energy configurations temporarily, which is essential for simulating systems at finite temperatures.
- Update the system: If the flip is accepted, update the spin configuration accordingly. If it’s rejected, keep the current configuration.
- Repeat: Repeat steps 2-5 for a large number of iterations or until the system reaches equilibrium, where its properties stabilize.
By iterating through these steps, the Metropolis algorithm allows us to simulate the behavior of the Ising Model at different temperatures and study phenomena such as phase transitions. It’s a powerful tool for understanding the collective behavior of many interacting spins in a material.
A NetLogo Simulation
The Ising Model can be simulated in NetLogo either by downloading NetLogo or running the model online. In the code section of NetLogo, you might want to change the color of the up spin from blue + 2 to red to match the colors of the schematic. See the yellow highlighted line below.
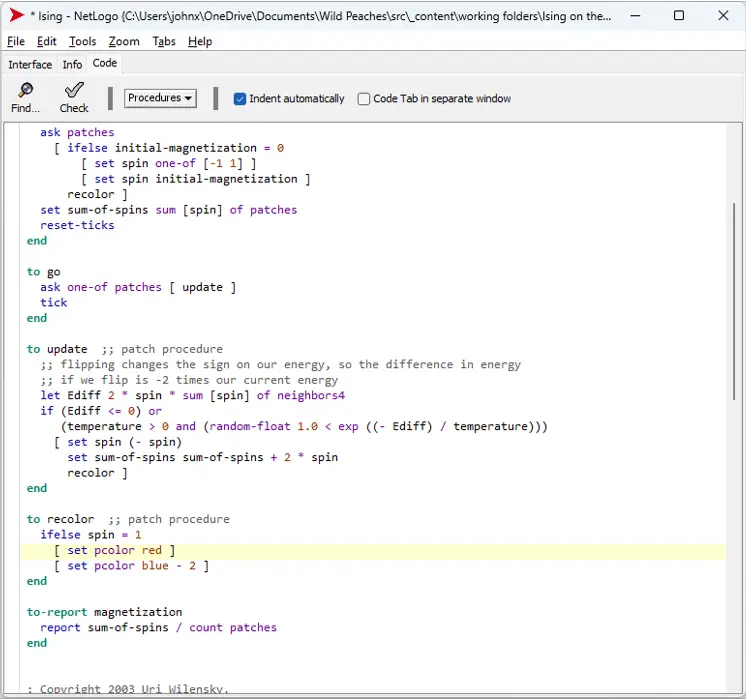
Ising NetLogo code.
To run the simulation, choose an initial temperature and click setup-random, then go. Watch the “Magnetization” graph evolve as spins flip from to or vice-versa. Next, try starting with all spins in the same direction, setup -1 or setup +1.
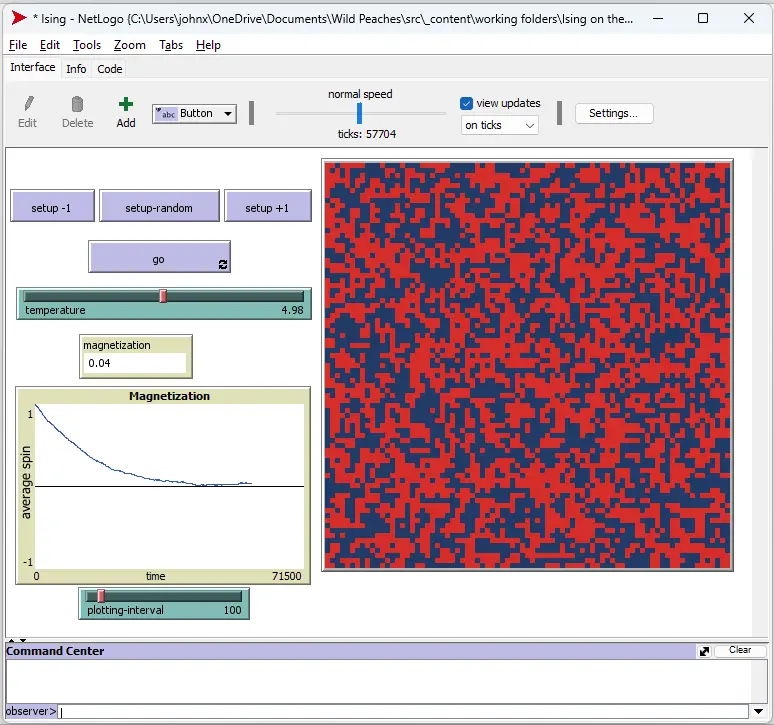
Ising model simulation.
Initially, the average spin is because all dipoles are up, but over time random flips bring the average back to near . What happens if the temperature is set very high or very low?
The Ising Model for Phase Transitions
While the NetLogo simulation helps visualize how individual spins interact and align under different temperature conditions, this same model can be applied to understand more complex physical phenomena - particularly phase transitions like the transformation of ice to water or water to steam. Just as we observed how temperature affects the alignment of magnetic dipoles in our simulation, similar principles govern molecular behavior during phase changes in matter.
When you click setup -1 to orient all spins in the same direction, this ordered state is analogous to molecules locked in a crystalline ice structure. The energy bonus from hydrogen bonding between adjacent molecules (represented by the first term of ) encourages this uniform alignment, just as the coupling parameter influences spin alignment in our magnetic model. As temperature increases, both magnetic spins and water molecules gain enough energy to break free from their ordered arrangements. This parallel between magnetic and molecular behavior makes the Ising Model a useful tool for studying phase transitions across different physical systems.
At higher temperatures, the molecules are more free to reorient as they transition from the ice phase to the water phase. A larger value for the parameter Ediff leads to a sharper transition between phases. Try plotting the sum of all grid couplings (the sum of Ediff for all molecules):
to-report energy
let total-energy 0
ask patches [
let Ediff 2 * molecule-orientation * sum [molecule-orientation] of neighbors
set total-energy total-energy + Ediff
]
report total-energy
end
You can modify the model by adding a new plot for total-energy. For a phase transition, rather than ‘Magnetization’ you could rename the plot to ‘Order Parameter’ which measures the average angle between each molecule’s orientation and a reference angle (like a crystal axis). Lower values indicate more alignment. Change ‘average spin’ to ‘average alignment’ or something similar.
Bringing It All Together: From Theory to Practice
The Ising Model, despite its origins in magnetic systems, has proven to be a remarkably versatile tool for understanding how local interactions lead to global changes. We’ve seen how this elegant mathematical framework can help explain phenomena ranging from forest transitions to Arctic ice melt, but its applications don’t stop there.
Jakub Nowosad is a computational geographer working at the intersection between geocomputation and the environmental sciences, and is an Assistant Professor at Adam Mickiewicz University in Poland. He used the Ising Model to simulate the transition from forest to open areas in two recently published articles, Simulating spatial patterns with the spatial kinetic Ising model and Optimizing the parameters of the spatial kinetic Ising model to simulate spatial patterns. He used R rather than NetLogo for his simulations, but the results are similar.
Try It Yourself
Here are some hands-on ways to explore these concepts:
- Temperature Experiments
- Using the NetLogo simulation, try running the model at different temperatures
- Record how quickly the system reaches equilibrium at each temperature
- Create a graph showing the relationship between temperature and equilibrium time
- Pattern Recognition
- Take photographs of natural boundaries (like forest edges or coastlines)
- Compare these patterns to those generated by the Ising Model
- Try adjusting the model parameters to match real-world patterns
- Custom Applications
- Modify the NetLogo code to simulate other binary systems like:
- Urban development (built vs. unbuilt areas)
- Disease spread (infected vs. healthy populations)
- Opinion dynamics (agree vs. disagree)
- Modify the NetLogo code to simulate other binary systems like:
Practical Applications
The principles we’ve explored have real-world applications in:
- Environmental Science: Predicting ecosystem transitions and tipping points
- Urban Planning: Understanding how neighborhoods develop and change
- Social Sciences: Modeling the spread of behaviors or opinions in communities
- Materials Science: Designing new materials with specific properties
The Ising Model can help us understand the complex patterns that emerge from simple interactions. Whether you’re interested in physics, ecology, or social systems, this model provides a powerful framework for exploration and discovery. The model is an easily understood representation of many real-world interactions where nearest-neighbor states influence surrounding states. It may be useful for improving global warming models such as described in the paper Ising model for melt ponds on Arctic sea ice, and who knows, maybe you can use it to solve this difficult maze problem.

Maze proof establishes a ‘backbone’ for statistical mechanics.
Code for this article
Ising NetLogo
Software
- NetLogo - NetLogo is a multi-agent programmable modeling environment.
- R - R is a language and environment for statistical computing and graphics.
- RStudio - RStudio is an integrated development environment (IDE) for R.
References and further reading
- Ising - NetLogo Modeling Commons
- Monte Carlo, Metropolis and the Ising Model
- Ising model
- The Ising model
- Optimizing the parameters of the spatial kinetic Ising model to simulate spatial patterns - Jakub Nowosad
- Simulating spatial patterns with the spatial kinetic Ising model - Jakub Nowosad
- Numerical Solutions to the Ising Model using the Metropolis Algorithm - Danny Bennett
- Phase diagram of the square 2D Ising lattice with nearest neighbor and next-nearest neighbor interactions - Harold J. W. Zandvliet
- Metropolis–Hastings algorithm - Wikipedia
- The Ising Model - Jeffrey Chang, Notes on Statistical Mechanics II
- Ising model for melt ponds on Arctic sea ice - Yi-Ping Ma, Ivan Sudakov, Courtenay Strong and Kenneth M Golden, New Journal of Physics, 2019
Image credits
- Hero: Ivy Sheet Cake, Homestyle Bakery Nashville, TN.
- Wilhelm Lenz: Wilhelm Lenz at the Institute of Physics
- Ernst Ising: Biography of Ernst Ising
- Dipole moment of the water molecule: BYJU’s
- Schematic representation of a configuration of the 2D Ising model on a square lattice. Sascha Wald
- Maze Proof Establishes a ‘Backbone’ for Statistical Mechanics - Quanta Magazine